
High Scale Adobe Commerce in the Wild – Reflections and Learnings – By Max Chadwick — Senior Solutions Architect
Rightpoint recently supported one of our clients through a high scale traffic event on Adobe Commerce’s cloud infrastructure. In this post, I’ll share some details on the event and what we learned in the process.
To start out with, here’s an overview of the tech stack in use. The merchant in question is hosting a traditional Magento store front (e.g. not PWA studio) on Adobe’s cloud infrastructure. Magento v2.4.3-p2 was deployed, running on PHP 7.4.22.
In order to handle peak load, Adobe’s split architecture is in place. In addition to vertical scaling (which is available for all Adobe Commerce cloud environments), split architecture offers horizontal scaling for web nodes.
In preparation for the event, 6 web nodes were spun up to complement the 3 core nodes. Web nodes were c5.9xlarge instances (32 vCPUs / 72 GiB RAM) and core nodes were m5.8xlarge instances (32 vCPUs / 128 GiB RAM).
A few aspects of the application codebase are worth noting because, as you’ll see later, they became very relevant to the performance of the site under high load. Firstly, the merchant is using Stripe as a payment gateway via the official Stripe Magento module. Additionally, the customer data is being fetched via an external system provided by the merchant. This logic is implemented via a custom section source.
Finally, Queue-It virtual waiting room was introduced to support traffic overflow. While having a tool like Queue-It available during a high demand event is always a good defensive strategy, it’s especially important on Adobe Commerce, which, at the time of the traffic event doesn’t support auto-scaling.
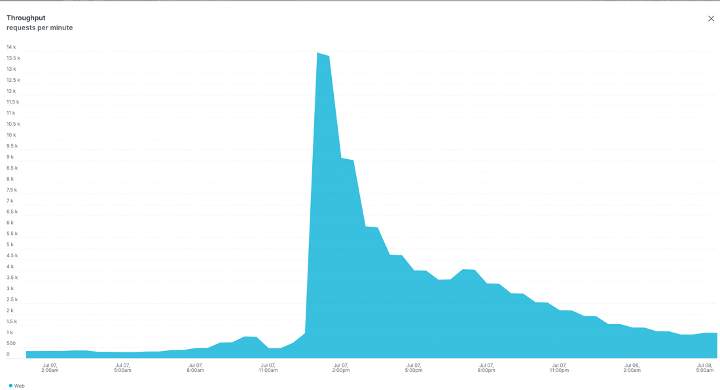
The environment came under high load upon the release of a line of highly anticipated products. Per the graph below taken from New Relic, peak load hit ~14K RPM, aggregated over a 30-minute bucket. It’s important to note that New Relic is tracking cached responses only and the actual amount of traffic is significantly higher thanks to the Fastly full-page cache.
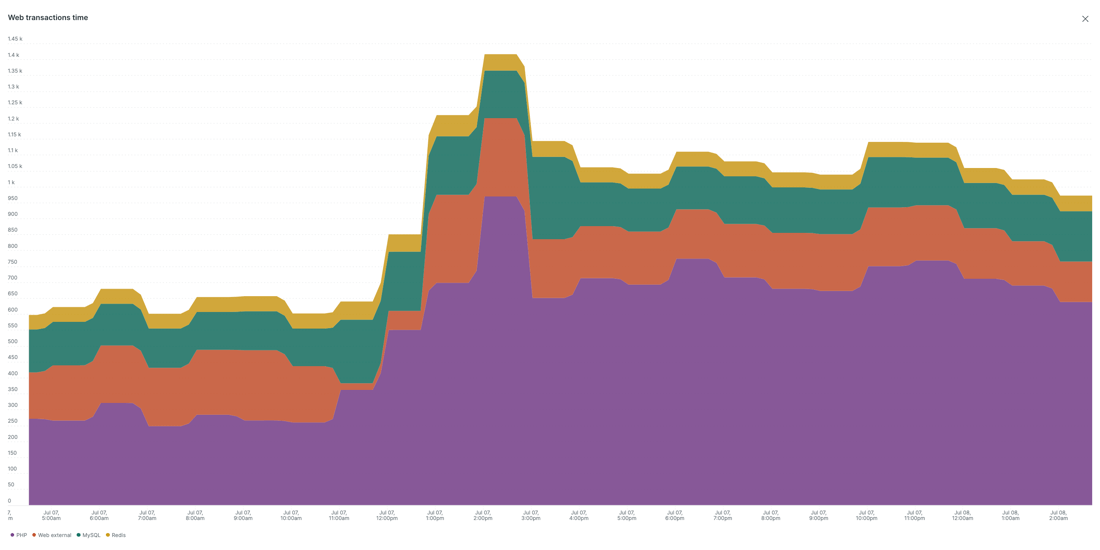
With Queue-It in place, per the Web Transaction Time graph from New Relic below, even with such a surge in traffic the impact to response time was minimal.
Over the course of the day over 25,000 orders were placed, with a peak of nearly 10,000 in a single hour and over 300 in a single minute.
CPU capacity on the web nodes emerged quickly as the primary bottleneck. The graph below from New Relic shows CPU utilization in the web nodes compared to the core nodes.
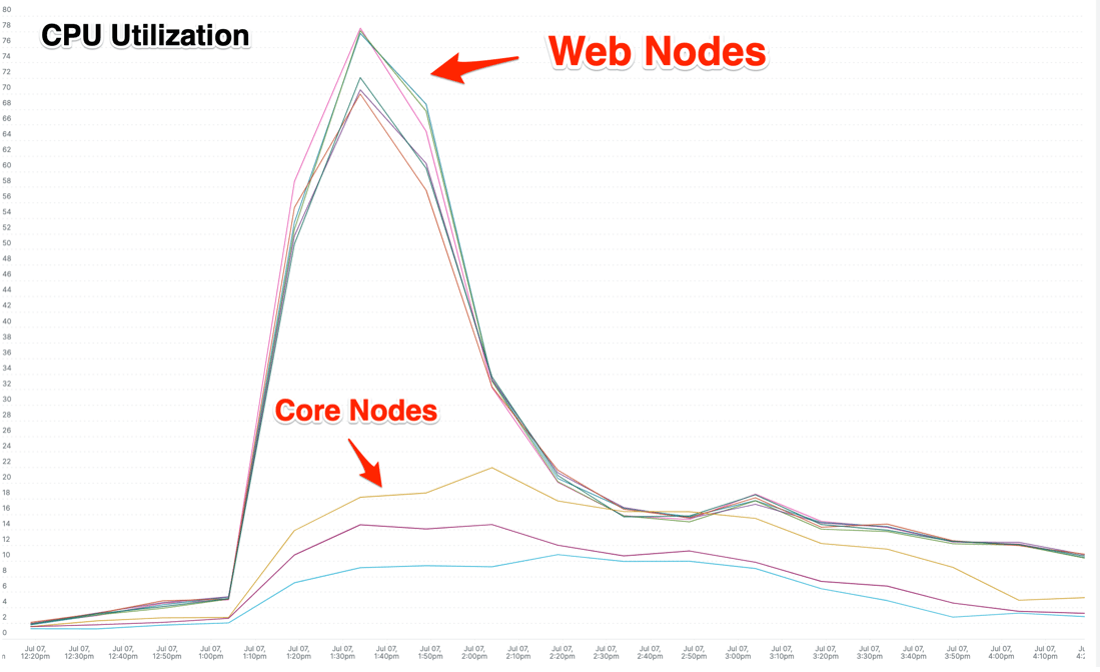
This finding was good news as it meant that the more scalable web node group was serving the bulk of the traffic, indicating that for future high traffic events it should be possible to handle more traffic by scaling the web nodes out horizontally.
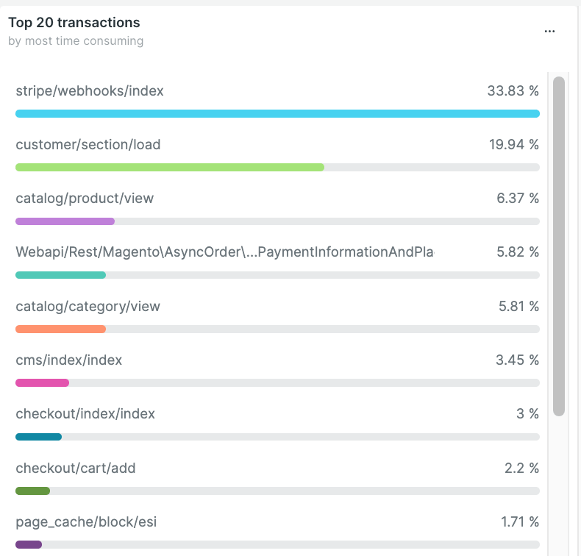
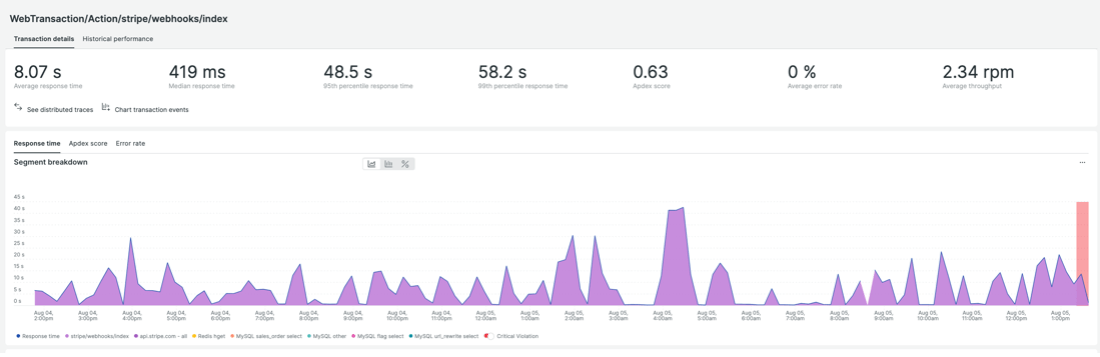
Once we identified the fact that the bottleneck resided with the web nodes, the next topic of focus was whether there were opportunities to optimize executing code or configurations. New Relic is also helpful here as it segments the traffic by “transaction” and tells us which of those transactions were most time consuming. While this doesn’t correspond exactly to CPU usage it’s a good way to triage issues. Here were the most time-consuming transactions, according to New Relic:
While, based on the CPU utilization data, scaling out horizontally will allow the merchant to handle more traffic in the future, additional optimization avenues can be pursued to allow more load to be handled without adding additional hardware resources.
Further profiling is recommended, but some initial findings are as follows:
The Stripe webhooks code is slow on an ongoing basis. Reviewing the reasoning for this and working to optimize it is the top priority. As this code is provided by Stripe, the issue will be reported to their team, however, in our experience, it’s more efficient for us to go to third parties with as much information on the issue as possible, or even a fix, if available.
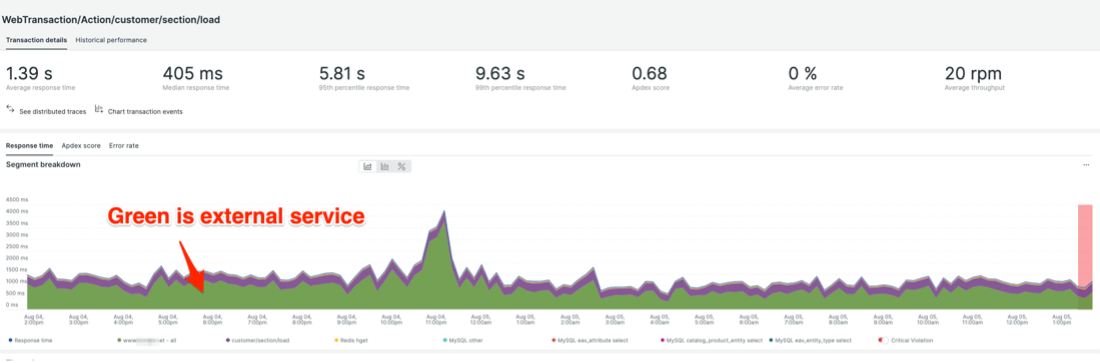
Calling an external service during customer/section/load is significantly slowing down processing time. The team is exploring opportunities for caching to reduce external dependencies but there are business tradeoffs to be considered. Additionally, if the external service can be optimized to reduce response time it will also improve customer experience during high traffic events.
Frequent cache clears of the high demand products are likely the main contributors to catalog/product/view and catalog/category/view load. One strategy we’ve talked about internally is reducing the frequency of cron runs. I’ve personally researched this topic in the past. During the high load the cron was running every minute but decreasing the cron run frequency to every 5 minutes, or even every 2 minutes will noticeably decrease the load on the infrastructure.
Rightpoint Commerce works with some of the largest Adobe Commerce Cloud implementations and has a positive track record collaborating with Adobe Commerce Cloud teams and clients to optimize and tune Commerce implementations. With access to profiling tools like New Relic, Rightpoint can provide directional guidance in addition to remediation services to deliver scalable, performant commerce.